


Among the challenges that new shared mobility operators face, whether in the ridesharing or carsharing space, is knowing when and where demand will be and how to optimize inventory accordingly.
This challenge of staying one step ahead of demand has been around for decades and is classically known in economics as “the newspaper problem”. It dates back to when people in the business of selling newspapers had to decide how many copies to print based on what they thought demand might be the next day. If we look at the unit economics of the problem, the cost to print was usually much less than the gross revenue generated per paper, so it made sense to print a few extra papers on the guess that they might sell, as the upside of one extra sale was usually more valuable than the downside of wasted paper. For decades, the economic optimization of this problem reduced to how many extra unsold paper vendors were ready to risk each day, knowing they would be worth nothing come tomorrow.
Modern demand optimization for a fleet shares this classic demand prediction concept, although ride and carsharing don’t devalue in the same way. Cars in a shared mobility fleet generally take months or years to build, finance, market, deliver, launch a digital platform, and get on the road. Cars don’t suffer from precipitous drops in value like yesterday’s newspapers, rather they risk the slow and costly fate of low utilization if they are not positioned in the right place at the right time. Particularly in the carsharing space, these expensive machines need to earn their keep for their fleet owners and beat the alternative rate of return for their investor’s capital. Modern operators simply can’t afford the newsprint strategy to “have a few extra cars sitting around for when demand happens”.
To solve this demand challenge in the shared mobility space, Ridecell uses a proprietary modeling workflow that fits a custom spatio-temporal model to the geography and the user base of each of our customers’ markets. What works in one country, with one set of user behaviors, traffic patterns and laws doesn’t necessarily work to predict demand elsewhere. The model needs to be fit to local conditions to capture the spatial and temporal structure of the demand in that market.
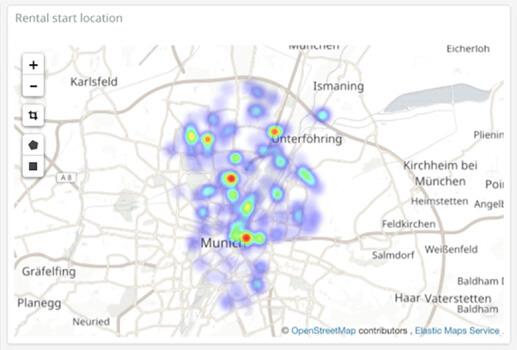
To represent demand in a given market, we start by thinking about the urban landscape from a data science perspective, and how to best fit a spatio-temporal model. The structure of the data involved spans from: streets and freeways that are fixed and discrete, the demand they carry is continuous spatially but strongly localized with “hot” and “cold” spots, as well as time-varying with hourly, daily, weekly and seasonal components. For example, one of our carsharing customers might have reserved parking at a shopping mall that has a lot of foot traffic; or alternately a parking stall near a subway station that commuters want to access. It would make sense that the subway station would see a lot of demand at commute hours, while the time structure of demand at the shopping mall would be quite different. Additionally, if one looks at the spatial structure in these two demand examples, it might show nearly zero user demand just a few hundred meters away from a hot spot, possibly within the same parking lot. So creating a modeling schema that can incorporate this spatial structure on a time scale and spatial scale that is useful for operational decision-making is critical.
Because real user demand data is tied to the physical landscape at some level of granularity, the real modeling challenge is to be able to capture the time-varying components of demand at every point in that space. For this second part, we use time-series modeling techniques that let us predict user demand at every point in our customer’s service area. These models are then placed into an automation engine that Ridecell developed in-house to test an algorithm offline and validate its performance. This way we are continuously running machine learning “bake offs” before a model gets deployed into production and can demonstrate that it performs better than other models.
By applying this approach to each of our customers, in a specific geographic area with a specific user pattern, we are able to provide our customers a best-of-breed demand prediction model on our platform, specific to their operations. This use of data science is just one more way that Ridecell provides efficiency to its customers – powering the future of shared mobility.
Author: Shawn Higbee, Senior Product Manager, Data Science, Ridecell